Simsets: explainable time series data
We have simulated some time series data for you. The data set, which can be downloaded from here consists of an output time series (y) and a set of explanatory time series. Here is a time series plot of (y):
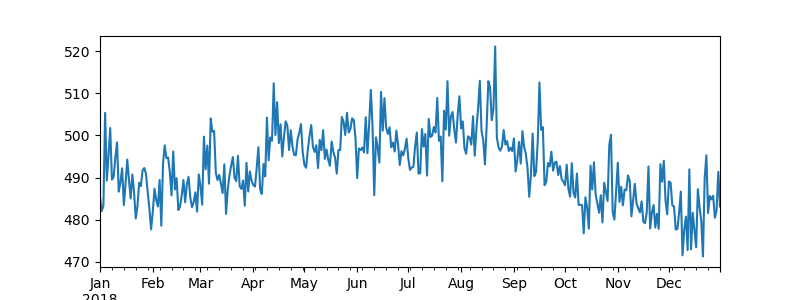
Try refreshing the page to generate another data set!
With simulated data we know the underlying process that generated that data. This makes it very useful for tasks where we need to know the right answer. These include:
- Testing forecasting and prediction methods
- Testing methods which try to explain a time series using other variables
- Testing the claims of service providers who say they can do either of the above
- Creating interview questions
- Creating examples for teaching
The data generating function
The data generating function for the simulated data is given by the following equation:
$y_t = 540.82 + 0.33t + 1.20 s_t + 8.89 h_t + \epsilon_t $
Where:
$t = 0, 1, 2 \ldots, n$
and $s, h, v_i$ are the seasonality, holiday and events variables in the generated data set. The effect of the events include a carry over effect and are modelled recursively as follows:
$\epsilon_t \sim N(0, 3.54^2)$
The $e_i$ correspond to the events variables in the data set.
You can use this information to evaluate the results in the use cases above. For example, you might suppose that the (y) are sales, and one of the events is advertising. You could then attempt to recover the true effect of the advertising using a particular modelling or algorithmic approach. Note, if you include the parameter output_type=json in your call to the API then the endpoint will return both the observed data and the true contributions for each variable.